 Loading... Please wait...

- Home
- John Dewan's Stat of the Week
- Lamar Jackson
John Dewan's Stat of the Week - Lamar Jackson
Top 5 QB Prospects: Performance by Throw Location
Posted by By Keegan Abdoo on Apr 26th 2018
Here at Sports Info Solutions, we track the direction and throw depth of every throw made at the FBS level, as well whether the ball was catchable or not. A huge conversation this draft season has been about the top five quarterback prospects and how well their true accuracy was represented by their Completion Percentage. Our On-Target Percentage statistic (simply catchable throws divided by all throws) captures a player’s ball placement ability much better than Completion Percentage, as it isolates a quarterback’s accuracy from his target’s ability to catch the ball.
On that note, we have visualized each of the top five quarterback prospects’ accuracy and Target Share (percent of total attempts) by location of their throw. The size of the circle represents the Target Share, the color represents their On-Target Percentage relative to FBS average for that location (red = bad, yellow = average, green = good), and the number in the circle is their observed On-Target Percentage. We’ve included both 2016 and 2017 for these players to increase their sample sizes.
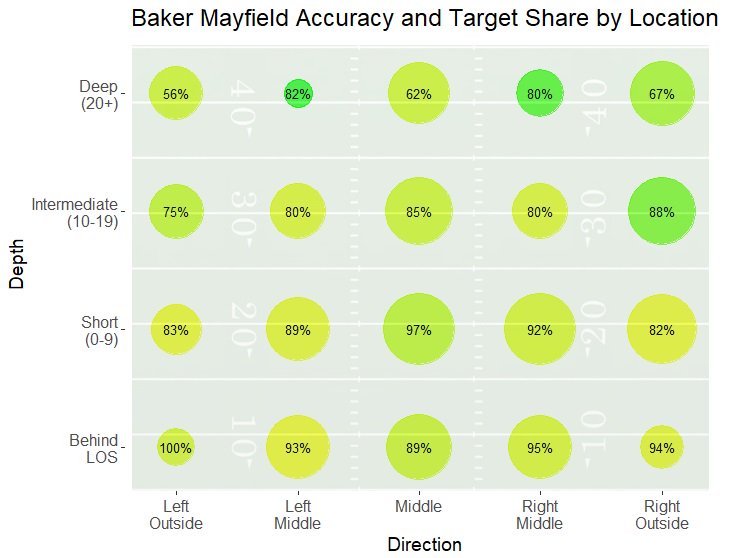
Baker Mayfield
In summary: Was consistently accurate all over the field.
Baker Mayfield has had above average to elite accuracy almost everywhere on the field. Directionally, he most frequently threw passes between the hashes and to the right sideline outside the numbers.
From a throw depth perspective, he ranked in the top two (amongst these five QBs) in throws behind the line of scrimmage and in deep and intermediate areas. However, he threw by far the fewest passes in the 0-to-9 yard range of any QB in this group at 33% (which was seven percentage points less than any other QB).
When comparing his accuracy to FBS average, he had four of the five biggest differences in this group in On-Target Percentage: Deep Right Middle (+32%), Deep Left Middle (+31%), Intermediate Right Outside (+27%), and Deep Right Outside (+18%).

Sam Darnold
In summary: Could stick a deep throw to the right sideline at an elite level.
Sam Darnold presented more of a mixed bag. Directionally, he slightly favored his right, especially outside the numbers.
His accuracy was most impressive compared to FBS average in the Deep Middle (+17%) and Deep Right Outside (+15%), but he attempted three times as many throws (52 attempts vs. 17) to that Deep Right Outside area.

Josh Rosen
In summary: Majority of throws were short, potential West Coast Offense fit.
Josh Rosen absolutely loved throwing in that bread basket right in front of him in the short middle—he had a higher percentage of his attempts here than any other of these QBs had in any area (13%).
Likewise, this conservative throw distribution (whether by scheme or a bad offensive line) showed up again in his deep throw percentage, which ranked last by a considerable margin. By direction, nearly two-thirds of his throws were between the numbers.
His accuracy didn’t really stand out in any area other than the Intermediate Left Outside (+14%); this was his only area which he placed in the top 20 (of the 100 depth and direction combinations) in terms of the difference between his On-Target Percentage and the FBS average.
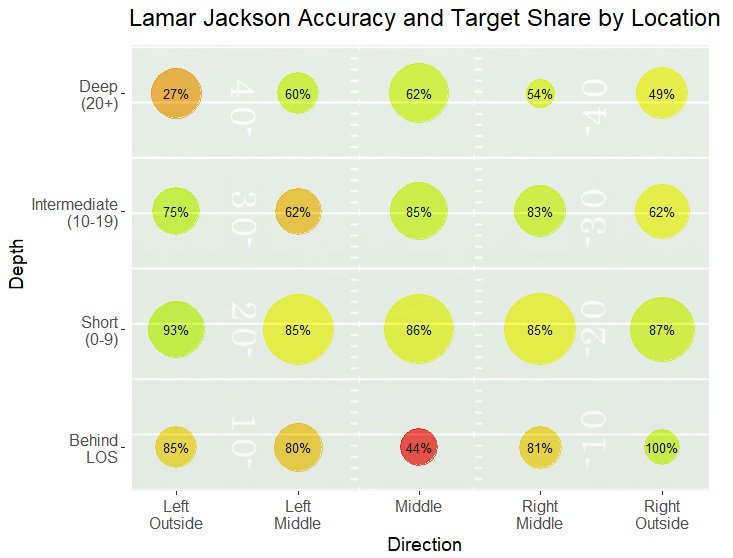
Lamar Jackson
In summary: Threw short the most, deep middle sweet spot.
Jackson did have the highest percentage of throws to the short area (46%), but he had the second fewest percentage of throws behind the LOS (13%) and lowest in the intermediate area (23%).
Jackson really loved the Deep Middle—his Target Share in this area (6%) was highest of any prospects in any deep section, and his On-Target Percentage was elite (8% above FBS Average) on a big sample. However, his two most accurate areas compared to FBS average were interestingly both to the left and outside the numbers—specifically the Short Left Outside (+13%) and Intermediate Left Outside (+12%).

Josh Allen
In summary: Works sideline and deep the most.
And finally, we have Josh Allen, an inaccurate QB whose arm strength and mobility still entice teams to think about his potential. To be fair, Allen’s throw locations were often to some of the hardest places to complete passes on the field, as his 51% Target Share outside the numbers was 12% more than the next QB (Darnold, 39%).
Correspondingly, he was averse to throwing in the middle and left middle areas, ranking last in both. He also led in the percentage of his throws that were deep (22%) and intermediate (27%), while having the least amount of easy throws behind the LOS.
While his accuracy generally was below average, he did excel in the Deep Right Middle compared to FBS average (+19%, which ranked fourth overall among these 100 combinations). However, that was on only 19 attempts, so sample size beware.
After diving deep into accuracy by ball location, a lot of the narratives from this draft season actually hold up pretty well. Allen was, in fact, asked to make harder throws than everyone else.
But even after controlling for the difficulty of throws, there is no QB who even came close to Mayfield in terms of being consistently accurate no matter where he threw the ball.